FunnelMapper.io Review 2026: Visualize Your Sales Funnel Without the Guesswork
FunnelMapper.io Review 2026: Visualize Your Sales Funnel Without the Guesswork
Part of the ScalePlus Suite of 33+ Tools
The Funnel Blindness Problem
You're driving traffic to your funnel. Conversions are happening. But you can't see: where visitors drop off, which steps need optimization, or why 80% never reach checkout. You're flying blind, making decisions based on gut feeling rather than data.
Without funnel visualization, critical problems stay hidden: 70% abandon on payment page but you don't know it, traffic hits dead ends because navigation is unclear, high-intent visitors leave before converting because of one broken step. The result: you're spending $5,000-15,000 monthly on ads without knowing which funnel steps are killing conversions.
Traditional analytics show visits and conversions but miss the journey between. Google Analytics tells you 1,000 people visited and 20 converted (2% rate), but not which specific step lost the other 980 people. Fixing funnel issues blindly wastes money, you optimize the wrong steps while the real problems go unnoticed,
Funnel visualization tools exist but are expensive or complex:
Hotjar costs $32-99 monthly ($384-1,188 annually).
Crazy Egg costs $29-99 monthly ($348-1,188 annually).
ClickFunnels includes basic analytics but costs $147-297 monthly ($1,764-3,564 annually).
Standalone analytics tools require technical setup and cost hundreds yearly.
Introducing FunnelMapper.io, a funnel visualization and analytics platform included in the ScalePlus suite from Scale.gg. It provides visual funnel mapping, drop-off analysis, conversion tracking, A/B testing, heatmaps, and native integration with landing pages and CRM, all for $994-$1,196 annually (which includes CRM, email marketing, and 33+ in total) instead of $348-3,564+ per year for Hotjar, Crazy Egg, or ClickFunnels.
Get FunnelMapper.io with ScalePlus
But before we explore whether it's the right funnel analytics solution for your business, let's understand exactly why flying blind costs so much money...
The Traditional Funnel Analytics Problems
Google Analytics (Limited Funnel View): Shows traffic and conversions but poor funnel visualization. Can't easily see which specific step loses visitors. Requires complex setup for meaningful funnel tracking.
Hotjar ($384-1,188/year): Excellent heatmaps and session recordings. $32-99/month adds up. Focused on behavior analysis more than funnel conversion optimization.
Crazy Egg ($348-1,188/year): Good heatmaps and A/B testing. $29-99/month ongoing cost. Separate from CRM and business tools.
ClickFunnels ($1,764-3,564/year): Includes funnel analytics but expensive. $147-297/month focused on funnel building. Analytics basic compared to dedicated tools.
Each approach fails because: they're either too limited (Google Analytics), too expensive ($348-3,564/year), or exist separate from your landing pages, CRM, and customer data.
What Is FunnelMapper.io?
FunnelMapper.io is a funnel visualization and analytics platform that maps your complete customer journey, identifies exactly where visitors drop off, tracks conversion rates at each step, enables A/B testing, and integrates directly with your landing pages and CRM, so you know precisely which funnel elements to optimize for maximum ROI.
Core Philosophy: See the Journey, Fix the Leaks
Most analytics tools focus on endpoints, visits and conversions. The problem: this hides the journey between first visit and final purchase. FunnelMapper.io takes a different approach:
visualize the complete path visitors take through your funnel, identify exact drop-off points with data, test improvements systematically, and measure impact on revenue, turning optimization from guesswork into data-driven process.
The result: see that 45% drop off at payment page (not landing page), know which elements cause friction, test solutions and measure results, increase conversion rates 20-50% by fixing actual problems, all integrated with your funnel builder and CRM rather than disconnected analytics tool.
Access FunnelMapper.io in ScalePlus
How It Works: From Blind to Crystal Clear
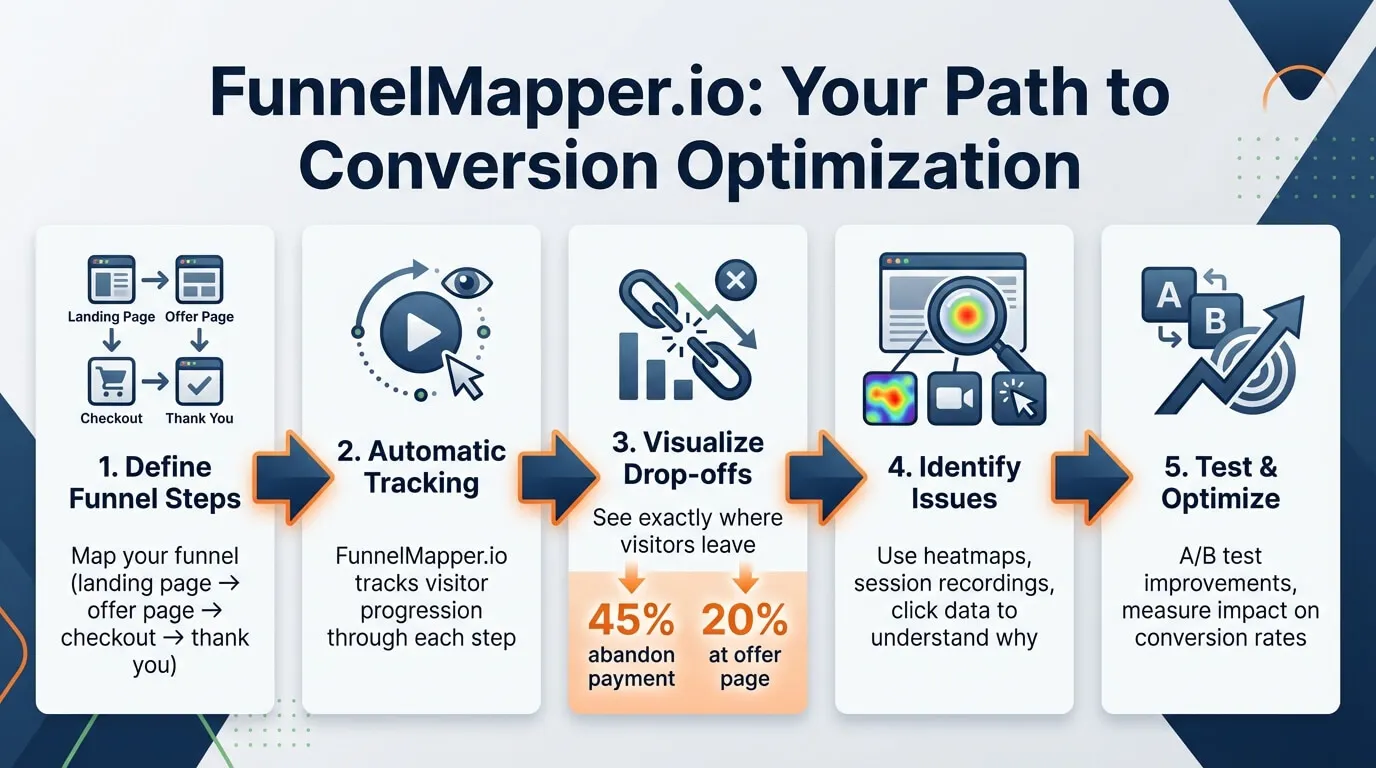
Analyzing funnels with FunnelMapper.io is straightforward:
- Define Funnel Steps: Map your funnel (landing page → offer page → checkout → thank you)
- Automatic Tracking: FunnelMapper.io tracks visitor progression through each step
- Visualize Drop-offs: See exactly where visitors leave (45% abandon payment, 20% at offer page)
- Identify Issues: Use heatmaps, session recordings, click data to understand why
- Test & Optimize: A/B test improvements, measure impact on conversion rates
What traditionally requires guesswork and assumptions now becomes data-driven: you see the problem, understand the cause, test the solution, measure the results.
Core Features: What FunnelMapper.io Does
Visual Funnel Mapping
See your complete funnel at a glance:
Step-by-Step Visualization: Visual representation of each funnel stage with visitor counts at each step.
Conversion Rates: Percentage who complete each step. See 1,000 visitors → 450 to offer (45%) → 180 to checkout (40%) → 45 purchases (25%).
Drop-off Identification: Instantly see which step loses most visitors—payment page, offer page, landing page.
Multiple Funnels: Track different funnels (free trial, paid offer, webinar registration) separately.
Time Analysis: See average time spent at each step—identify where visitors hesitate.
Visual mapping reveals optimization priorities immediately, fix the 45% payment page abandonment before worrying about landing page headline.
Heatmaps and Click Tracking
Understand visitor behavior on each page:
- Click Heatmaps: Visual representation of where visitors click—see what elements get attention
- Scroll Depth: Track how far down page visitors scroll—know if they see your CTA
- Move Heatmaps: See cursor movement patterns indicating interest areas
- Element Interaction: Track clicks on buttons, links, images—identify non-clickable elements visitors try to click
- Device Segmentation: Separate heatmaps for desktop vs mobile—different behavior patterns
Heatmaps reveal friction points: visitors clicking non-clickable elements (confusion), CTA below scroll depth (never seen), or ignoring your main offer (placement problem).
Session Recordings
Watch actual visitor sessions:
Playback Recordings: Watch exactly how visitors navigate your funnel—see mouse movements, clicks, scrolling.
Filter by Behavior: Watch sessions that abandoned payment page, or sessions that converted—compare differences.
Frustration Signals: Identify rage clicks (clicking repeatedly), dead clicks (clicking non-interactive elements), form abandonment.
Privacy Protection: Sensitive data (passwords, payment info) automatically masked in recordings.
Session recordings reveal problems analytics miss: visitors can't find the checkout button, payment form confuses them, or they're distracted by competing elements.
A/B Testing and Experiments
Test improvements systematically:
- Split Testing: Create variations of pages, split traffic 50/50, measure which converts better
- Element Testing: Test headlines, CTAs, images, pricing displays, form lengths individually
- Statistical Significance: Know when test has enough data for confident decision
- Multi-Variant Testing: Test multiple variations simultaneously
- Revenue Impact: Track not just conversion rate but revenue per visitor, optimize for profit
A/B testing turns hunches into proof: you think red CTA button converts better, test it, measure it, implement winner, increase conversion 15%.
Conversion Rate Analytics
Track the metrics that matter:
- Overall Conversion Rate: Total visitors to final conversion percentage
- Step-by-Step Rates: Conversion rate at each funnel stage
- Source Analysis: Compare conversion rates by traffic source (paid ads vs organic vs email)
- Device Breakdown: Desktop vs mobile conversion rates, optimize for each
- Time-Based Trends: Track conversion improvements over time as you optimize
- Revenue Per Visitor: Ultimate metric, total revenue divided by total visitors
Granular analytics reveal hidden opportunities: mobile converts 30% worse (need mobile optimization), or email traffic converts 2x better (invest more in email).
Form Analytics
Optimize your forms for completion:
- Field-by-Field Analysis: Track which form fields cause abandonment
- Drop-off Points: See exactly where visitors abandon forms (after email field? phone number?)
- Time to Complete: Track how long each field takes, identify confusing fields
- Error Tracking: Monitor validation errors visitors encounter
- Partial Submissions: Capture data from incomplete forms for follow-up
Form analytics pinpoint friction: 40% abandon when phone number field appears (remove it), or credit card field has 50% error rate (improve messaging).
Integration with Landing Pages and CRM
FunnelMapper.io's most powerful feature is native integration:
- Landing Page Connection: Automatically tracks funnels built in ScalePlus landing page builder
- CRM Data Enrichment: See which funnel steps each customer completed before converting
- Customer Journey View: Complete timeline showing every page visited, every click made
- Segmentation: Tag customers by funnel behavior (fast converters, comparison shoppers)
- Revenue Attribution: Track which funnel changes drove revenue increases
Integration eliminates data silos: funnel analytics, landing pages, customer records all connected, complete picture of customer acquisition.
Real-World Results
Emily, Course Creator: "My course funnel converted at 1.8%—terrible. I was spending $8,000/month on ads for 144 sales. FunnelMapper.io showed 62% dropped off at the payment page specifically. Session recordings revealed the problem: my payment form asked for phone number, triggering abandonment. I removed that field. Conversion jumped to 3.2% a 78% increase. Same ad spend now generates 256 sales. That's $112 additional sales monthly × $297 course price = $33,264 additional monthly revenue from one funnel tweak."
SaaS Founder: "We thought our landing page was the problem, low conversion rate. FunnelMapper.io showed the landing page converted fine (45% clicked through), but our pricing page only converted 4% to trial signup. Heatmaps revealed visitors weren't scrolling to see our features list below pricing. We redesigned pricing page with features above fold. Trial conversion: 4% → 11% (175% increase). We were optimizing the wrong page for 6 months."
FunnelMapper.io vs. Alternatives
FunnelMapper.io vs. Hotjar ($384-1,188/year)
Features: Hotjar excellent for behavior analysis, heatmaps, recordings, surveys. Industry leader in user experience analytics.
Cost: Hotjar Plus: $384/year. Business: $588/year. Scale: $1,188/year. FunnelMapper.io: $994-1,196/year total.
Integration: Hotjar separate platform. FunnelMapper.io native integration with landing pages and CRM.
Verdict: Hotjar for dedicated behavior analysis. FunnelMapper.io for integrated funnel optimization.
FunnelMapper.io vs. Google Analytics (Free)
Limitations: Google Analytics shows traffic and conversions but poor funnel visualization. Requires complex setup for meaningful funnel tracking.
Verdict: Google Analytics for basic metrics. FunnelMapper.io for actionable funnel optimization insights.
FunnelMapper vs. ClickFunnels Analytics ($1,764-3,564/year)
Focus: ClickFunnels focused on funnel building with basic analytics included. $147-297/month expensive primarily for builder.
Verdict: ClickFunnels for those needing only their builder. FunnelMapper.io for integrated platform with advanced analytics.
Calculating Your ROI
Current Optimization Costs
- Poor conversion: 2% rate × $10,000 ad spend = 200 customers × $100 = $20,000 revenue
- Blind optimization: Waste time/money fixing wrong problems
- Analytics tools: Hotjar $384-1,188/year, ClickFunnels $1,764-3,564/year
- Lost revenue: Poor conversions cost 50-100% potential revenue
With FunnelMapper.io
- Cost: $994-1,196/year (includes CRM, email, 15+ tools)
- Data-driven optimization: Fix actual problems, not guesses
- Conversion improvement: 2% → 3.5% (75% increase) = 350 customers
- Additional revenue: 150 more customers × $100 = $15,000 monthly = $180,000/year
- ROI: 180x on ScalePlus subscription
If FunnelMapper.io helps improve conversion from 2% to 3% (50% increase)—realistic with data-driven optimization, you generate $60,000-120,000 additional annual revenue on $10,000/month ad spend.
Who Should Use FunnelMapper.io?
Perfect For:
Course Creators: Optimize course funnels to increase enrollment rates and reduce acquisition costs.
E-commerce Stores: Track product page → cart → checkout → purchase funnel, identify cart abandonment causes.
SaaS Companies: Optimize trial signup and activation funnels for maximum conversion.
Agencies: Optimize client funnels with data-driven insights rather than assumptions.
Less Ideal For:
- Very Low Traffic: Need meaningful traffic volume for statistically significant insights
- Single-Page Sites: No multi-step funnel to optimize
- Perfect Conversions: If already converting at 15-20%, limited improvement potential
Limitations to Consider
- Requires Traffic: Need sufficient visitors for meaningful data and A/B tests
- Learning Curve: Understanding analytics and optimization takes time
- Newer Platform: Less established than Hotjar or Google Analytics
- Implementation Needed: Insights only valuable if you act on them
Final Verdict: Is FunnelMapper.io Worth It?
FunnelMapper.io delivers visual funnel analytics that identifies exact drop-off points, explains why visitors abandon, enables data-driven optimization, and integrates with landing pages and CRM, turning guesswork into systematic conversion improvement.
Rating: 4.5/5 Stars
Strengths:
- ✅ Visual funnel mapping shows exact drop-off points
- ✅ Heatmaps and session recordings reveal why
- ✅ A/B testing validates improvements
- ✅ Native integration with landing pages and CRM
- ✅ Can increase conversions 50-100%
- ✅ Saves $384-3,564/year vs. analytics subscriptions
- ✅ Included with complete business platform
Weaknesses:
- ⚠️ Requires sufficient traffic for insights
- ⚠️ Learning curve for optimization
- ⚠️ Newer platform
- ⚠️ Insights require action
Recommended for: Course creators, e-commerce stores, SaaS companies, and agencies with 1,000+ monthly funnel visitors who want to identify and fix conversion killers systematically, without paying $384-3,564/year for Hotjar, Crazy Egg, or ClickFunnels.
Bottom line: If you're converting at 2-5%, spending $5,000-15,000 monthly on ads without knowing where visitors drop off, or paying $384-3,564 annually for analytics tools, FunnelMapper.io could identify your conversion killers, enable 50-100% conversion improvements, and generate $60,000-180,000 additional annual revenue, while saving $384-3,564 on analytics subscriptions.
Pricing
FunnelMapper.io is included in ScalePlus, not sold separately.
ScalePlus Pricing:
- Quarterly: $299 every 3 months ($1,196/year)
- Semi-Annual: $497 every 6 months ($994/year)
Includes FunnelMapper.io plus complete business platform with 17+ tools including CRM, email marketing, invoicing, scheduling, and more.
Value comparison:
- Hotjar: $384-1,188/year
- Crazy Egg: $348-1,188/year
- ClickFunnels: $1,764-3,564/year
- Potential revenue increase: $60,000-180,000/year
You're getting funnel analytics plus complete business platform for less than standalone Hotjar subscription, while potentially 50-100x ROI through conversion improvements.
Conclusion: Stop Guessing, Start Optimizing
FunnelMapper.io solves the fundamental funnel problem: eliminating the blindness that causes you to optimize the wrong elements while real conversion killers hide in plain sight.
Without funnel visualization, you're flying blind, spending thousands on ads without knowing where 80% of visitors abandon. You optimize headlines when the payment form is the problem. You redesign landing pages when the real issue is three steps later. Every optimization becomes expensive guesswork.
FunnelMapper.io changes the equation: see exactly where visitors drop off, understand why through heatmaps and recordings, test solutions systematically, measure impact on revenue, all integrated with your landing pages and CRM rather than disconnected analytics tool.
If your conversion rate is stuck at 2-5%, you're spending $5,000+ monthly on ads, or you're paying $384-3,564 yearly for analytics subscriptions, FunnelMapper.io deserves serious consideration.
Turn on the lights in your funnel
Your funnel has leaks. Find them. Fix them. Profit.
* * *
Disclaimer: This review is based on available information about FunnelMapper.io and ScalePlus. Platform features, pricing, and capabilities may evolve. Verify current details at Scale.gg before purchasing. This review may contain affiliate links, meaning we may earn a commission if you subscribe through our links at no additional cost to you.